What I learned
Map-driven apps are deceptively complex. A polygon on a map looks simple, but once you start tying it to weather forecasts, risk scoring, multi-user permissions, and historical data, you’re managing more state than you’d guess. This project was where I learned to lean hard on Next.js App Router, SWR for data fetching, and Mapbox’s idiomatic patterns rather than reinventing them.
The other lesson was about purpose-built risk UIs: dashboards that just show data are useless to a site manager. They need an at-a-glance answer to “is this site OK right now” and a clear path to “what should I do about it.” That framing shaped every layout choice.
What I did
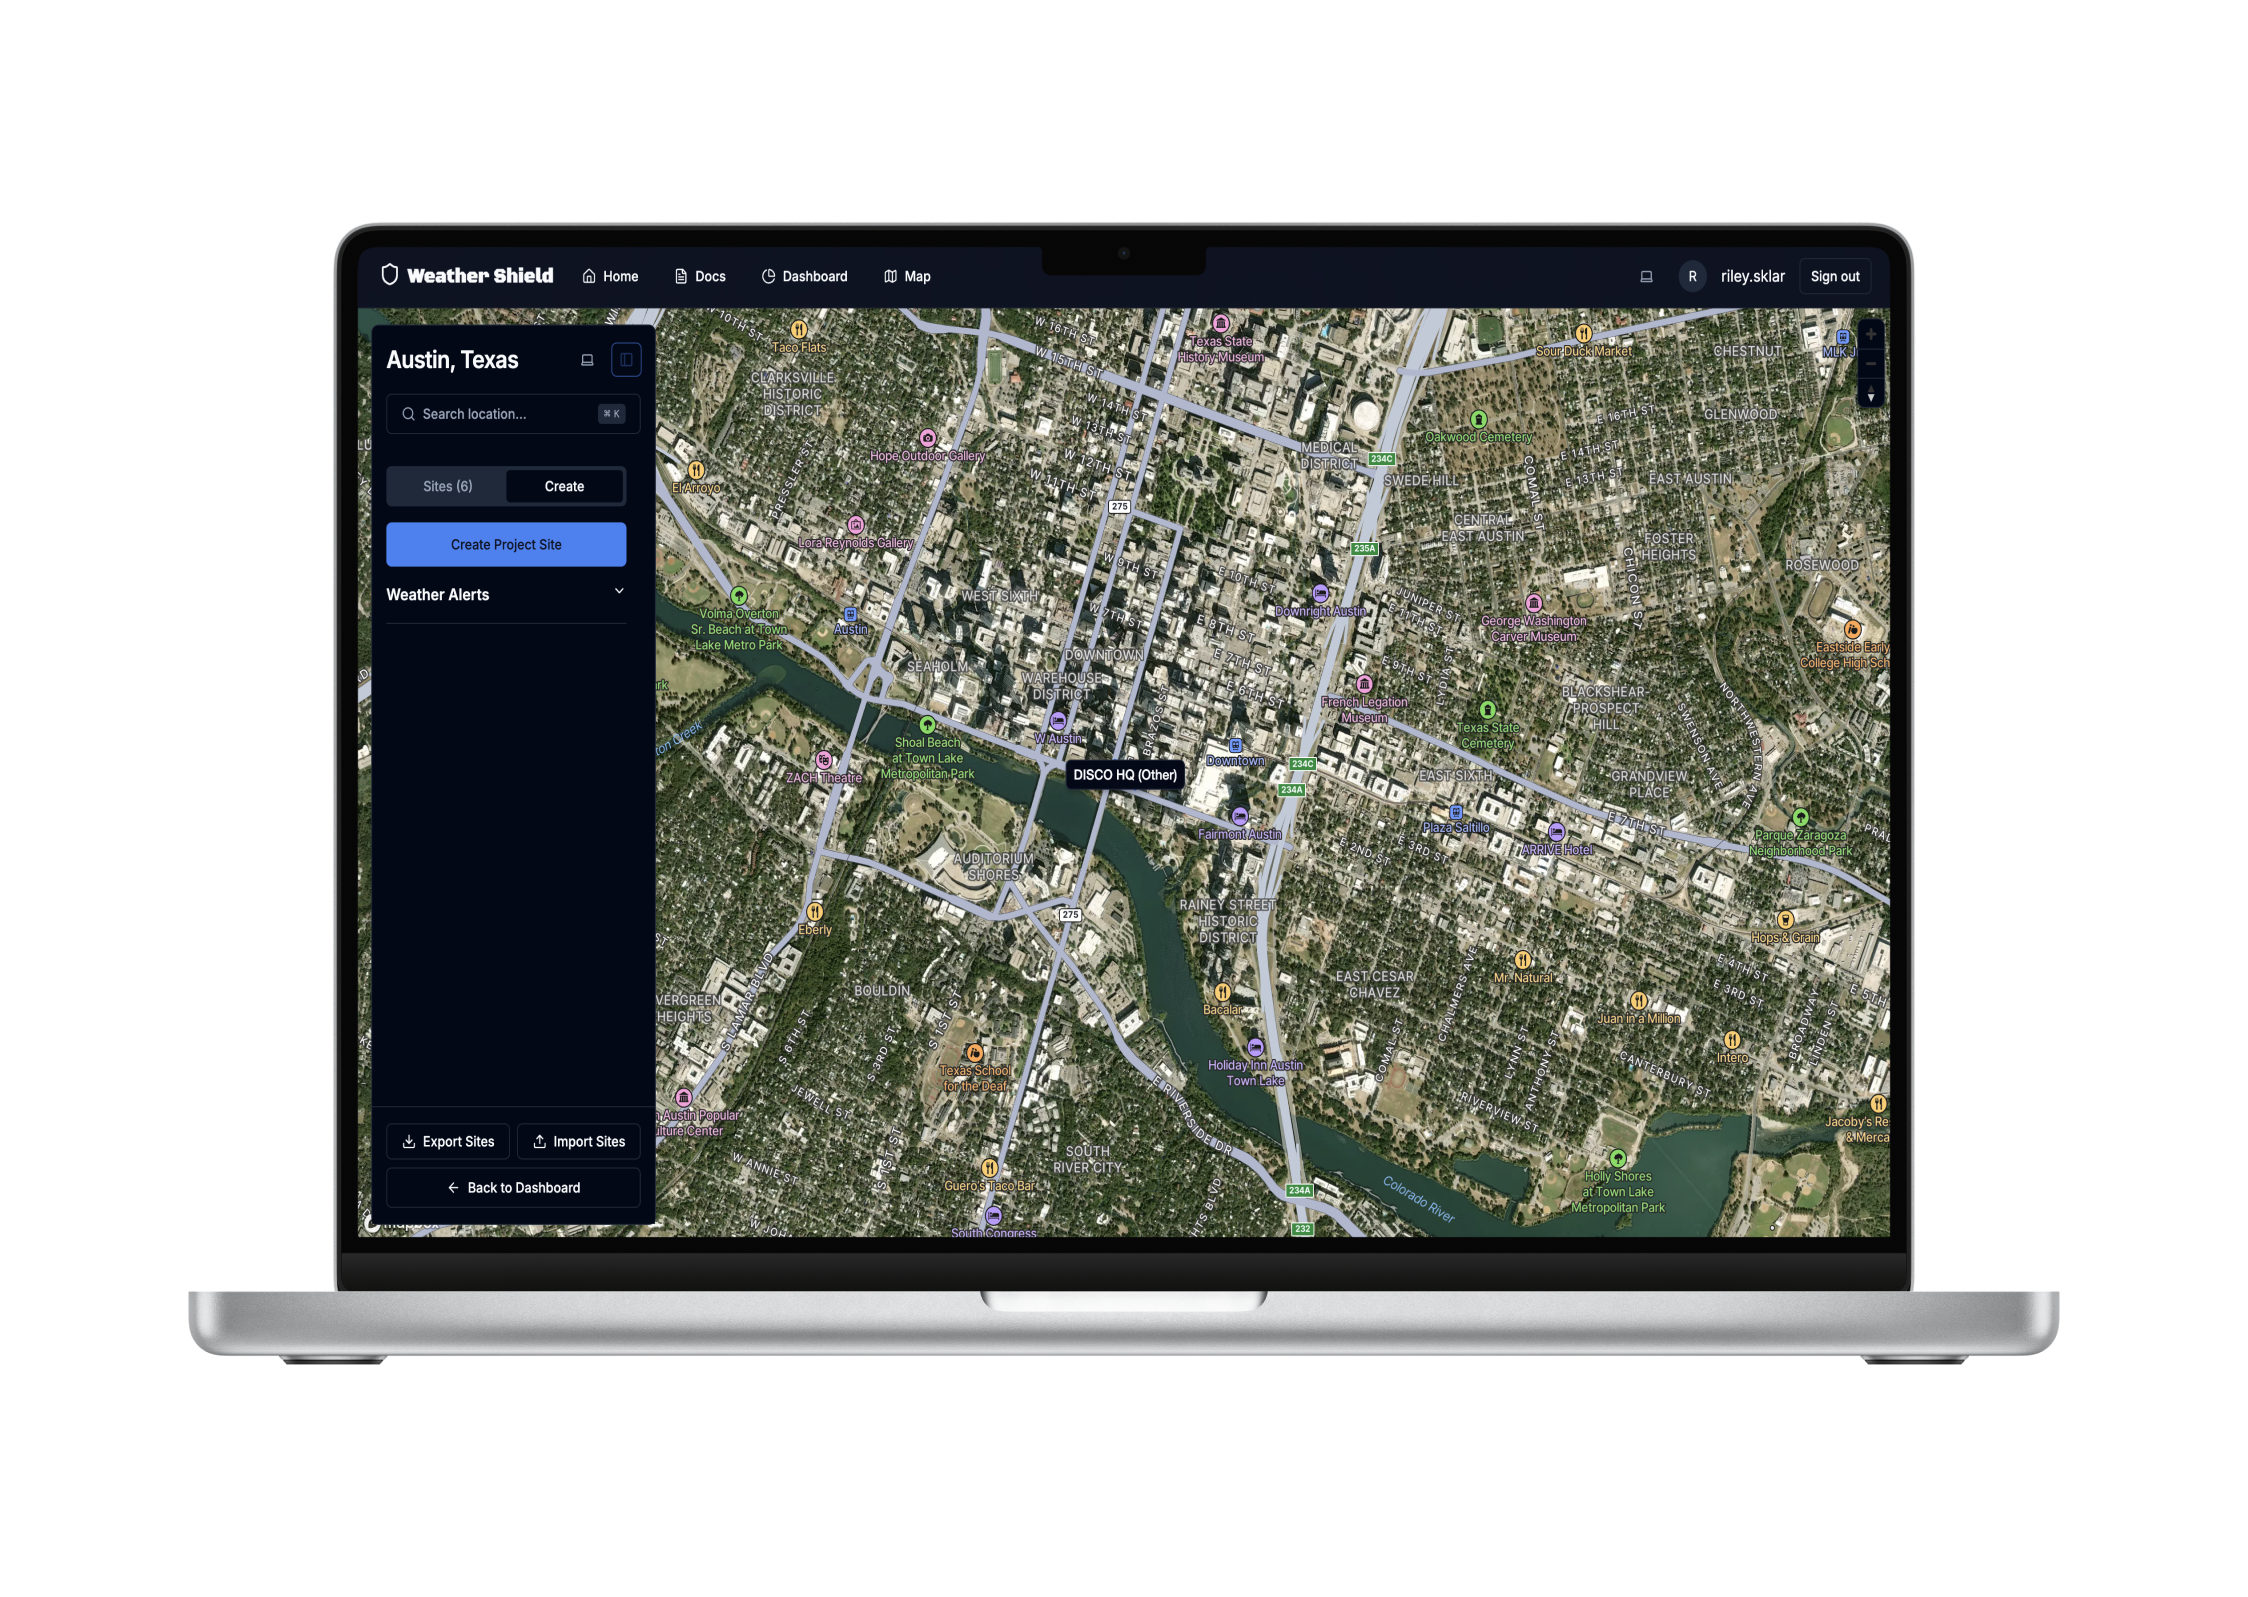
- Built site management — draw custom polygons on a Mapbox map to define project sites, categorize by type (Solar, Construction).
- Integrated the NOAA Weather API for real-time forecasts and historical pattern analysis.
- Implemented automated risk-level assessment per site with alerting on threshold breaches.
- Designed a dashboard with site filtering, weather history visualization, and weather overlays.
- Wired Supabase auth + row-level security so organizations only see their own sites.
What I shipped
A live platform at https://weather-shield.vercel.app/home that helps construction and solar operators monitor weather risk across distributed project sites. Next.js 14 App Router, TypeScript end-to-end, Mapbox + NOAA integration, Supabase auth — deployed on Vercel.